Emissions from Energy Consumption per $ of GDP
Comparing countries inland production and consumption of primary energy
Compare the ranking of top 20 countries based on their primary energy production
This graph represents production for primary energy. All units represent energy contents. No physical units such as mass or volumes are considered.
– US EIA Historical Statistics for 1981-2013
Compare the share of different energy sources in primary energy production
The overall primary energy (when all the energies are displayed) is the sum of each primary energy data calculated through the related TSP assumptions mentioned above. Thus, the overall primary energy production data presented in the graphs are slightly different from what is presented in EIA database under the labels Total Primary Energy Production.
Energy quantities regarding fossil fuels (oil, gas and coal) represent higher heating value (gross calorific content) and are given by the EIA using country specific calorific content of fuels.
The site is, however, useful indeed!
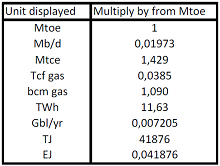
The unit conversion factors applied are following:
Nuclear energy represents the heat produced by fission and radioactive decay in the fuel (primary vapor heat equivalent is calculated from raw nuclear electricity IEA conversion : raw electricity/primary vapor heat equivalent = 33%)
Cross analysis of gas type and greenhouse gases emission sources
How to read this graph : 1 Mtoe = 1,4286 Mtce
– Etemad & Luciani for the period 1900-1980
I completed the data with US EIA for recent years and merged energy taxonomies and country lists.
Tags :Primary energy statisticsEnergy productionLine chart
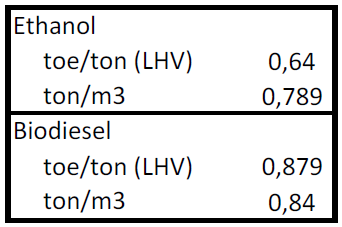
The biodiesel and ethanol energy contents are calculated from volumes given in EIA data and represent lower heating values (net calorific content), the following density and calorific content are then applied:
Based on the outstanding work from Bouda Etemad and Jean Luciani who synthetized historical energy statistics, Olivier Rech and Aurlie Heyris had already started to digitalise fossil fuels production data when I joined TSP in 2010. I continued digitalising data concerning peat, nuclear, hydro and geothermal electricity.
U.S. Energy Information Administration, International Energy Statistics,Go to EIA database, data accessed 5 August 2014..
Is the dataset on historical energy production available with the original data from Etemad-Luciani? In order to use the present dataset in this website we would have to know the specific country energy content established by EIA.
All data is loaded in Energy unit Mtoe (Million tons of oil equivalent)
Long term perspective on energy supply is always an appreciated chart … but original data in a digital format used to be a scarce resource !

On the contrary, energy quantities under hydro, geothermal, wind, solar, tide and wave and biomass and waste energy correspond to raw electricity production.
Visualize the evolution of how much carbon emitted for every dollar of GDP

Bouda Etemad and Jean Luciani, World Energy Production 1800 1985, ISBN 2-600-56007-6, Data digitalized and published with agreement of B. Etemad